
Every line, every shift, in numbers you can act on today
A production monitoring system shows what your lines are doing right now and why they were not running when they were not — counts, rates, downtime with reasons, OEE. It removes the month-end surprise: finding out in a report that a line underperformed for three weeks when it could have been fixed in week one.
Willowark builds monitoring on data collected straight from equipment, not operator estimates. Machine states come from PLCs and sensors; operators add only what machines cannot know — downtime reasons, entered through a fast touchscreen picker designed to take seconds, because a reason-code system that slows people down gets abandoned by Thursday.
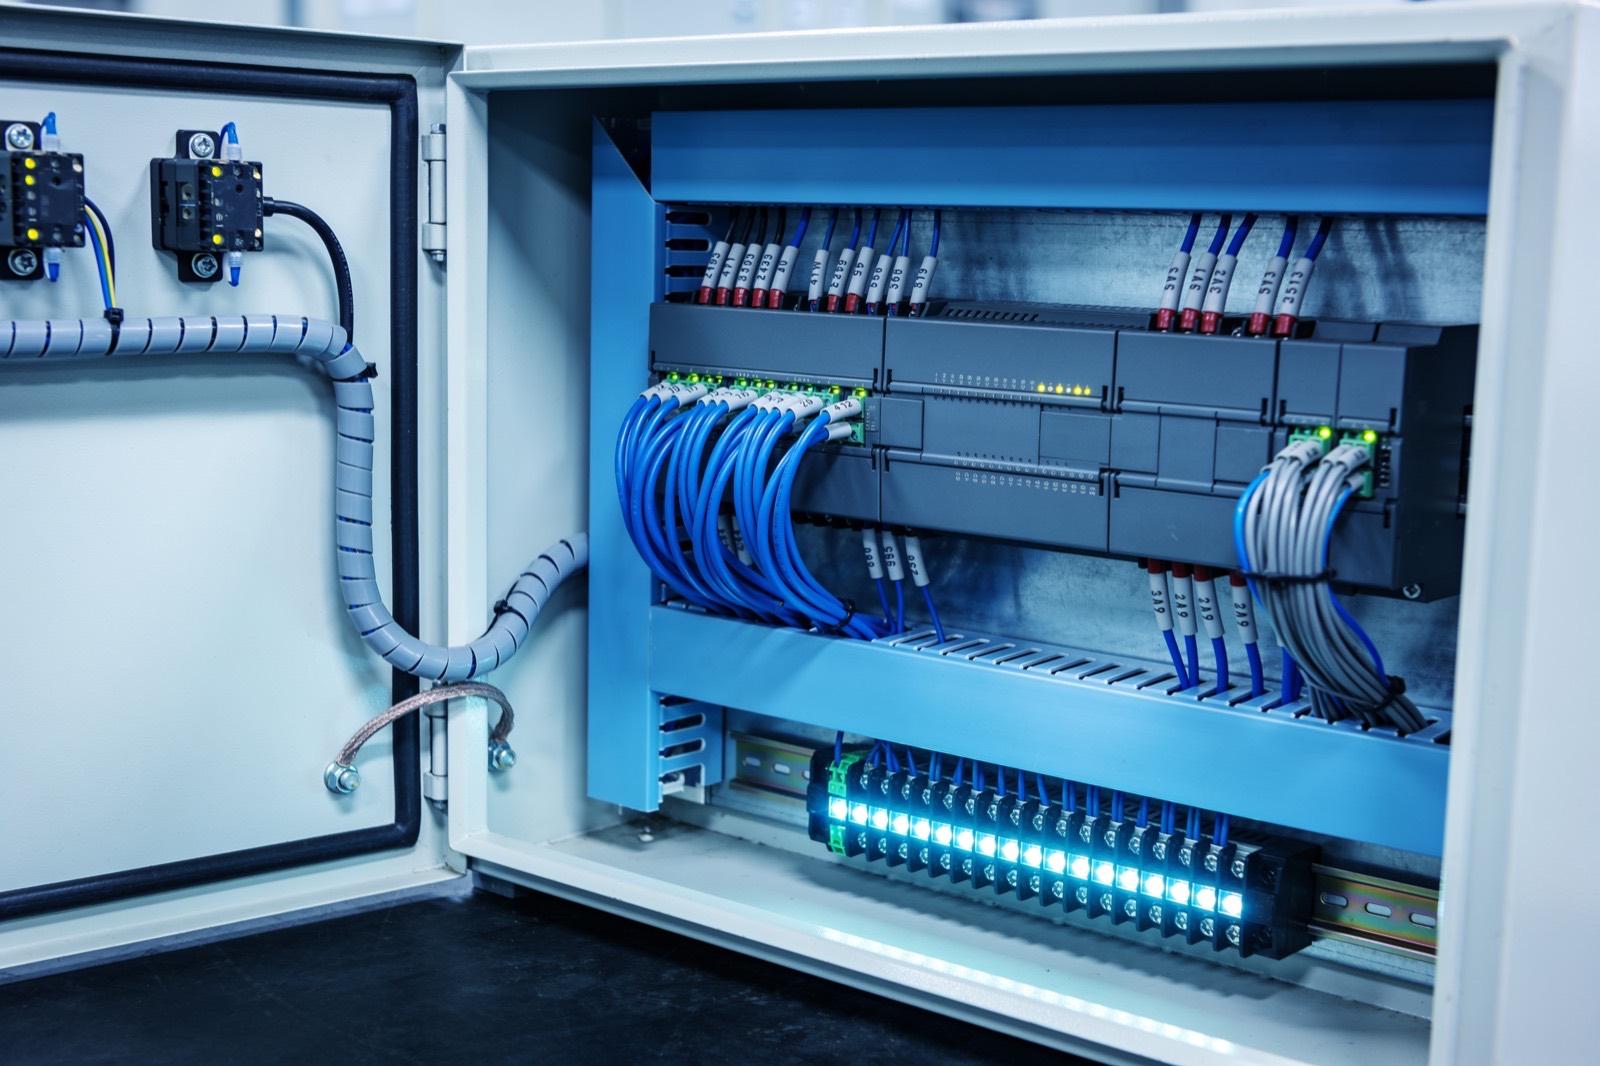 Industrial Automation
How the work gets done
The same way every time: scope, build, hand over.
A working system layers several pieces: acquisition from the machines, a state model that turns raw signals into running, starved, blocked, faulted, and changeover, OEE math with honest definitions of planned time and ideal rate, andon-style alerts when a line is down past a threshold, and dashboards tuned to each audience — big screens on the floor with current state, trend views for supervisors, Pareto charts of downtime reasons for the improvement team. Data lives in a time-series store with an API so it also feeds ERP and BI tools.
The test of success is behavioral: morning meetings start from the same screen instead of competing spreadsheets, the top downtime reason each week is a specific fixable thing rather than 'other', and OEE moves because the losses finally have names. We tune the system in its first weeks on the floor — thresholds, reason trees, screen layouts — because the first version of any reason tree is always wrong somewhere.
Scoping starts with a state definition workshop, because the hard part of monitoring is agreeing what running actually means. We walk each line with supervisors and operators, list the signals available from the machines, and decide what counts as planned downtime, changeover, and a micro-stop before any code is written. Reason trees are drafted with the people who will pick from them and kept shallow. We also settle the ideal rate per product honestly — from engineering data or best demonstrated run, not a nameplate nobody has hit — and write the definitions down, because an OEE number without documented definitions is not comparable to anything.
Rollout is usually one line first, running for a few weeks while thresholds and reason trees are tuned, then the rest of the plant by repetition. The usual failure modes are known: reason prompts that interrupt at the wrong moment, a state model that reads a slow cycle as a stop, and dashboards that show everything and therefore nothing. We design against each with operator feedback during the pilot and simple, audience-specific screens. Handover includes the state model and OEE definitions in writing, the reason tree with edit rights for your team, dashboard source, and training for supervisors on reading the Pareto rather than just the number.
Scope it in writing
What we agree before work starts
- Machine state model and OEE configuration per line
- Operator downtime-reason interface designed for sub-ten-second entry
Build with checkpoints
Working results, not slide decks
- Floor, supervisor, and management dashboards
- Alerting for down events past defined thresholds
Hand over something you own
Documentation, source, and training
- Downtime Pareto reporting for continuous improvement
- Written OEE definitions, state model, and reason-tree governance document
Sound familiar?
Where production monitoring systems earns its keep.
A filler line that stops twelve times a shift with no record of why
OEE reported monthly from spreadsheets nobody fully trusts
Supervisors discovering a slow shift only after it ends
An improvement team choosing projects by anecdote instead of Pareto
Ask about Production Monitoring Systems
Describe the problem. Get a straight answer.
One line is enough. An engineer replies within a business day.
Related work
Radar centering system for steel mills
Components:
- Radar sensors (strip position): Non-contact radar reading strip edge position in a hot, dusty, vibrating environment where optical sensors fail.
- Edge controller (signal processing): Turns raw radar returns into a clean lateral offset in real time.
- Mill PLC (centering actuators): The mill's existing controller: receives the offset and drives the centering actuators.
- Operator HMI (live position): Live strip position for the operator.
Connections:
- Radar sensors to Edge controller (raw returns)
- Edge controller to Mill PLC (offset)
- Edge controller to Operator HMI
A steel-mill systems provider · Steel manufacturing
Radar-based centering system for steel mills
End-to-end engineering of a radar sensing system that measures and centers material on steel mill lines — from equipment assessment through hardware selection, electrical engineering, software, installation, and commissioning.
Read the case study →Common questions
Asked before every production monitoring systems project.
How is this different from what our ERP or MES already reports?
ERP knows what was reported to it, usually after the fact and at order granularity. A monitoring system watches the machines themselves, second by second, and explains the gap between what the line could have made and what it did. The two work best connected — monitoring feeds ERP better numbers.
Will operators actually use the downtime reason screens?
They will if entry takes seconds and the categories match their reality. We build reason trees with the operators who will use them, cap the tree depth, auto-capture everything the machines can detect, and only ask humans for what machines cannot know. Adoption is a design outcome, not a compliance campaign.
What does OEE actually tell us, and can it be gamed?
OEE multiplies availability, performance, and quality into one number — useful for tracking a line against itself over time. It absolutely can be gamed with soft ideal rates or generous planned-downtime definitions, which is why we document the definitions and keep them fixed. The trend matters more than the absolute number.
Can monitoring run on machines that have no PLC or network connection?
Yes. A machine state can usually be inferred from a retrofit signal — a current clamp on the main motor, a proximity sensor at the output, or a tap on the stack light — wired to a small edge device. The data is coarser than a modern controller provides, but running versus stopped and a reliable count cover most of what OEE needs, and these retrofits are typically inexpensive.
How long before the numbers are trustworthy?
Usually a few weeks on the first line. Early data exposes definition problems — a state that misfires, a reason category nobody picks, a count sensor that double-triggers — and the pilot period exists to find and fix those. We do not recommend making decisions from the first week's OEE. Once counts reconcile with physical production and the top downtime reasons are specific, the system is ready to run the morning meeting.

Where this sits
Production Monitoring Systems, inside a industrial automation system.
The lit component is the part of the system this service delivers; the rest is what it has to work with.
Hover or focus a component to see what it is and what it talks to. Arrow keys move between them.
Sensors and machines report into the PLC; the PLC drives the HMI and publishes tags to a historian; the historian feeds dashboards and, where it exists, the MES.
Components:
- Machine (press, cell, line): The equipment itself. Newer machines expose tags; older ones need a sensor or a serial tap.
- Sensors (counts, temps, current): Retrofit sensors where the machine offers nothing: proximity counts, current transformers, temperature.
- PLC (control): The controller: logic, safety, and the tag table everything else reads.
- HMI (operator): Operator screen at the machine.
- Historian (tag store): Time-series store of PLC tags: uptime, counts, faults, cycle times.
- Dashboards (OEE, downtime): Plant TV and office views: OEE, downtime reasons, shift comparison.
- MES / ERP (orders): Work orders down, production counts up.
Connections:
- Sensors to PLC over 4-20mA
- Machine to PLC over EtherNet/IP
- PLC to HMI over EtherNet/IP
- PLC to Historian over OPC-UA
- Historian to Dashboards over REST
- Historian to MES / ERP over REST, both directions
Strategy. Software. Systems.
Have a system that should exist?
Tell us what your operation is doing manually, what isn't connected, or what you're trying to build. We'll tell you plainly whether and how we can help.